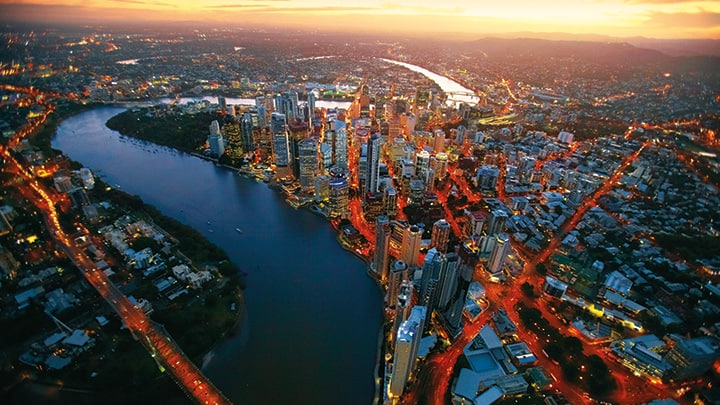
Brisbane receives almost 6 hours of ‘peak sun’ per day. According to the Clean Energy Regulator and the APVI, Queensland leads the charge of percentage of dwellings with a PV system – at around 32% – with over 1600MW in installed PV generation and almost the same again in the pipeline. Brisbane solar, especially for residential homes, plays a major part in this.
As such, many Brisbane and Queensland citizens have taken advantage of the power of solar, but haven’t taken a look at solar batteries. Whether you are looking to upgrade your panels, put in a new system, or add solar battery storage to your place, Saving With Solar can help. Read on below to learn more about our list of Brisbane solar companies and which steps you should be taking to ensure you get the maximum result to save the most money with your solar installation!
Best Solar Installers in Brisbane
There are many solar companies in Brisbane and we’ve come up with some below.
Some other Brisbane solar quotes are available from:
- Solargain (1300 739 355)
- REA Solar (1300 360 047)
- MC Electrical (07 3268 3836 – these guys are certified to install the Tesla Powerwall 2 and Mark also has a great solar blog)
- SAE Group (1300 182 050)
- Infinite Energy (1300 074 669)
Brisbane Solar Battery Quotes
As we noted before, over 30% of the households in Brisbane already have solar panels on them. If you’re not on one of the 44c/kWh grandfathered tariff plans, you can often save money but installing a solar battery and changing to a peak/off peak tariff with your solar provider.
Although the Tesla Powerwall 2 is all the rage and some people are even waiting for the Powerwall 3 release date, there are a range of options that are just as functional with less of a price tag:
How much money can I save?
This is quite difficult to answer without looking at your specific circumstances, but we can give you a rough idea before handing you over to one of our qualified installers. First of all, ideally you would like your panels to be facing north on an angle around 20-40′ from horizontal to receive maximum efficiency from your panels. In a perfect world this isn’t always possible but as long as you sit down with your installer and conduct a thorough analysis of your roof you’ll be able to maximise your result. Sometimes even if you’re not able to achieve optimum conditions due to trees, roof sloping or location, simply adding an extra solar panel can be enough to make up the shortfall.
In short, although not all houses will be able to get the ‘optimum’ orientation – it’s important that you use a trusted solar installer who will sit down with you and use the latest technology to offer you the best result for your circumstances.
| Brisbane Solar Output (assuming ~85% efficiency) | |
| System Size |
Averaged (over a year) daily output |
| 1.5kW | 5.7kWh |
| 2kW | 9kWh |
| 3kW | 13.5kWh |
| 4kW | 19kWh |
| 5kW | 23kWh |
| 10kW | 46kWh |
Brisbane Solar Uptake – Suburb by Suburb
Which suburbs in Brisbane have the most solar power installed? Have a look at this data from the Energex website, current as of September 2017:
| Suburb | Postcode | Count | Installed Solar PV Capacity (kW) |
| VALDORA | 4561 | 87 | 15380.25 |
| BUDERIM | 4556 | 3616 | 12458.64 |
| CABOOLTURE | 4510 | 2643 | 10172.896 |
| NARANGBA | 4504 | 2572 | 9799.02 |
| FOREST LAKE | 4078 | 2725 | 9046.67 |
| MORAYFIELD | 4506 | 2342 | 8865.87 |
| HELENSVALE | 4212 | 2384 | 8740.6 |
| UPPER COOMERA | 4209 | 2241 | 8622.13 |
| NORTH LAKES | 4509 | 2168 | 8201.44 |
| CAPALABA | 4157 | 2231 | 8039.74 |
| JIMBOOMBA | 4280 | 1966 | 7738.79 |
| DECEPTION BAY | 4508 | 2093 | 7557.52 |
| ALBANY CREEK | 4035 | 2089 | 7556.24 |
| SUNNYBANK HILLS | 4109 | 2293 | 7546.04 |
| BURPENGARY | 4505 | 1970 | 7455.79 |
| REDLAND BAY | 4165 | 2040 | 7444.71 |
| BRACKEN RIDGE | 4017 | 2164 | 7375.96 |
| KALLANGUR | 4503 | 2108 | 7346.11 |
| ROBINA | 4226 | 2078 | 7299.9 |
| ALEXANDRA HILLS | 4161 | 2129 | 7293.86 |
| CARINDALE | 4152 | 1991 | 7285.67 |
| THORNLANDS | 4164 | 1892 | 7026.035 |
| NERANG | 4211 | 1725 | 6795.19 |
| VICTORIA POINT | 4165 | 2054 | 6717.71 |
| BIRKDALE | 4159 | 1960 | 6674.81 |
| THE GAP | 4061 | 1773 | 6341.795 |
| CALAMVALE | 4116 | 1971 | 6326.41 |
| ORMEAU | 4208 | 1572 | 6011.09 |
| EIGHT MILE PLAINS | 4113 | 1708 | 5946.45 |