What’s in the future for Solar Power in Australia?

The International Monetary Fund has underlined revisions to the growth prospects of the Australian economy. This marking an end to the economic growth that followed the 2008 financial crisis, as Australia is faced with bleak prospects in the 2020-2021 financial year. As politicians and fund managers scramble, the golden question seems to be what will spur growth not just in the short term, but into the future.

Australia is looking to leaders in Europe who have their own stimulus package coming in at $1220 billion AUD in size, which is heavily investing in energy and clean transport. This vision is supported by not only the economic benefit of job creation, but it provides a sustainable environmental solution, in what is fast proving to be a daunting threat in climate change around the world. 

Leading economies seem to share this vision, although not entirely. China is approving coal-fired plants at the fastest rate since 2015, while also heavily investing in electric transportation. India is heavily invested into renewable energy and so is Japan. Australia in its own right has continued to pursue its national projects including the “200% renewable Tasmania” announcement by the Tasmanian government. While bright spots are found, there is still an abundant need for a stimulus that looks beyond the next 5 years of economic recovery. 

The prospect of renewables seems to be improving for businesses and home owners. With renowned problems such as costs and efficiency being gripes of consumers in the past, the renewables market has shown a continuity of innovation over the past two decades. The improvement in engineering has pushed the efficiency of silicon solar cells closer to their theoretical maximum while improving innovations seek to maximize the sunlight the panels can be exposed to. Resulting in higher returns coming from renewable energy systems, such as solar, while being more accessible to individuals around Australia.

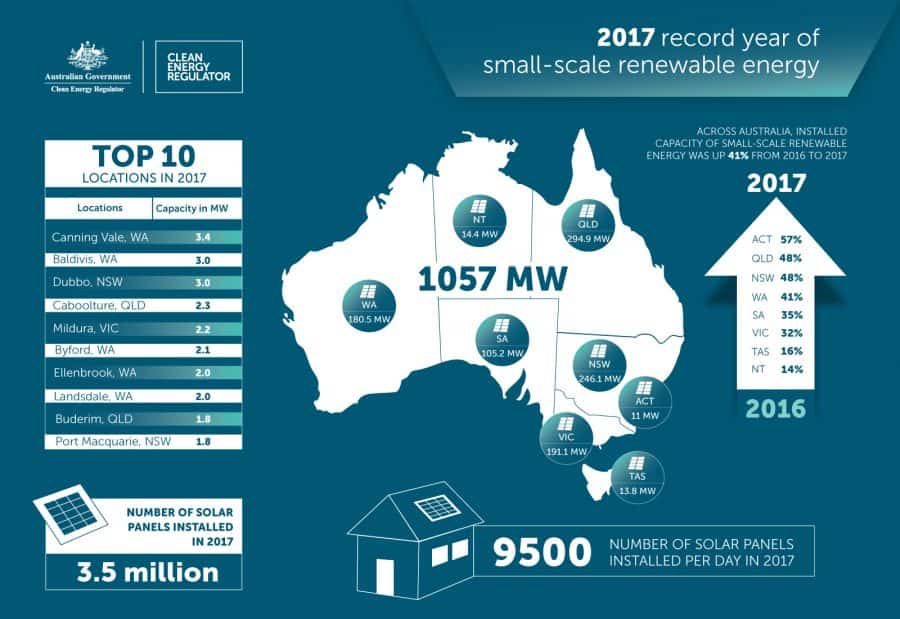
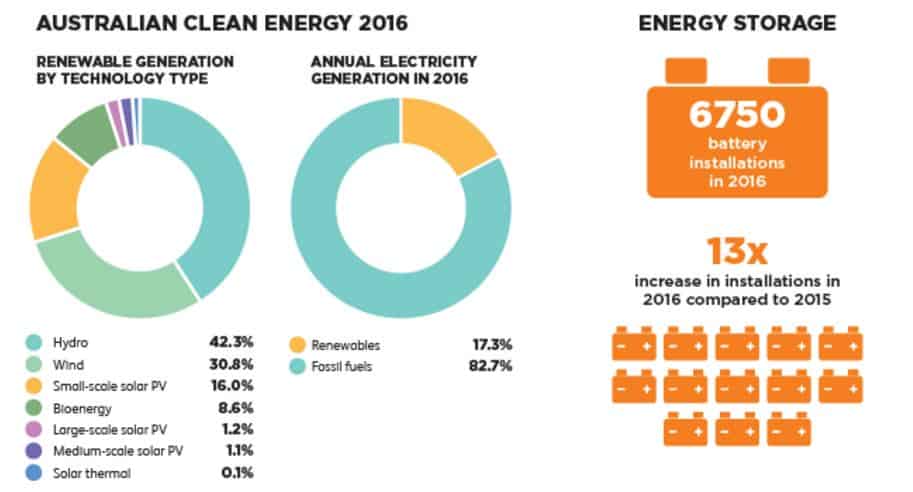
Solar energy increasingly has been lowering in cost as the market for the products matures and the labor required is more accessible, resulting in Australians moving from a reported 16% of all electricity generated by Solar or Wind to 40% in 2030. This being attributed to lowering costs and increased return on investment. It seems that the market for solar in particular is an enticing offering for consumers.

The question comes then of how to formulate a stimulus to drive the growth of renewable energy, to not only fight climate change, but fight the impending economic catastrophe of COVID-19. Demand from consumers and businesses present an opportunity for further incentives, while the fallout of 2020 may have a profound impact on the targets set for the next 20 years, which will have far reaching effects.

Whether we emerge from a turbulent 2020 looking towards a better future is entirely up to us, and it seems apparent that renewables, particularly solar could be the way to look when looking to drive productive economic growth. 

Read More Solar News:

Solar Energy Australia Statistics – 2017

Solar Energy Australia Statistics – The Clean Energy Regulator released their report on solar power uptake in Australia in 2017. A record 3.5m solar panels were installed on rooftops last year, with their combined output of 1057MW around the same as a mid-sized coal-fired power station. 

Solar Energy Australia Statistics

Small-Scale Renewable Energy in Australia 2016 – 2017(source: cleanenergyregulator.gov.au)

The 1057MW was installed by Australian homes and businesses in 2017, mostly from rooftop solar. That’s the equivalent of 9,500 solar panels being installed in Australia every day of 2017! Commercial solar had a huge influx of big solar systems installed which helped with the numbers. Here are some of the many businesses that installed solar power in 2017: 

Clean Energy Regulator Executive General Manager Mark Williamson was pleased to see the solar uptake in all industries:

“We are seeing a wide cross-section of Australians – households, community centres, schools, and small businesses – receiving incentives under the small-scale renewable energy scheme,” Williamson said.

“Our data shows consumers are embracing renewable energy to take control of their electricity bills” Williams said on the CER website

According to Wikipedia, as of December 2017, Australia had over 7,024 MW of installed photovoltaic (PV) solar power. The CER report shows that in 2017 there was a 41% increase in installed renewable energy capacity compared to 2016. Queensland had the most solar panels installed (295MW), and the ACT showed the greatest annual increase – showing a massive 57% change from its 2016 figures. The CER report also showed that the average solar system size in Australia has increased by 200% – from 3kW to 6kw – as prices continue to decrease and technology increases rapidly. 

The small-scale Renewable Energy Scheme which created financial incentives for homes and small businesses to install small scale renewable energy systems has obviously had the desired effect. It’ll be interesting to see how 2018 fares as it’s already off to a roaring start. 


Solar Energy Australia Statistics

Read More Solar News:

Solar Power in Australia reaches 3.2% in 2016

The Clean Energy Council released figures on Tuesday that show Australians’ energy needs were powered by renewables to the tune of 17.3% in 2016 – the highest since Snowy Hydro was completed 50 years ago. 3.16% of this 17.3% renewable energy was from solar power in Australia – a massive jump of 29% from 2015. According to RenewEconomy, it’s expected to grow considerably in both small and large scale solar PV production – putting us well on track to reach our Renewable Energy Targets (RET) for 2020.

Solar Power in Australia

Clean Energy Council Chief Executive Kane Thornton advised that 10 major wind and solar farm projects were completed in 2016 and there are 20 more in the pipeline; he’s confident that we’ll reach our RETs with time to spare.

“Every month brings new project announcements. While total investment in large-scale renewable energy was $2.56 billion last year, $5.20 billion worth of projects have secured finance in just the first five months of 2017 and have either started construction or will begin this year,” Thornton said.

“Innovation continues right across the renewable energy supply chain and new technologies such as energy storage are beginning to get their time in the sun,” he was also quoted as saying. We assume the pun was intended.

Solar Power in Australia 2017

The Australian Renewable Energy Target 2020

Some more takeaway statistics from the report:

  • Renewable energy provided 17.3% of all Australia’s energy in 2016 – up from 14.6% in 2015.
  • 6,750 battery systems were installed in 2016, 13 times the number installed in 2015.
  • Hydro is still far and away the biggest contributor to Australia’s renewable energy, comprising 42.3% of the total amount.
  • In 2017, building a renewable energy plant is now cheaper than coal and gas-fired power plants.
  • About half of the projects already underway or set to commence in 2017 are for large-scale solar, due to price per kWh nearly halving in the last two years.
  • Approximately 17,500 GWh of renewable energy was created in 2016 – as the Renewable Energy Target is 33,000GWh we still have a way to go but progress is looking positive.
  • Large scale solar is almost 50% of its cost two years ago and is slated to play a huge part in reaching our RET in 2020.

Click here to read the Clean Energy Australia Report 2016 in full at the CEC website.

Read More Solar News: